Measures distance and velocity (bi-directional). Especially suitable for bulk solids level applications and beam-intrusion detection applications. Very narrow beam angle and fast response speed!
Several models available with beam angles from 1.5 to 4 degrees, 50m range.
Specs:
range: 1-50m
accuracy: distance +/-2cm or 1% (*),
velocity +/-2cm/s or 1%
response time: from 60ms
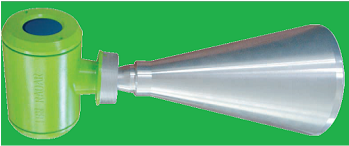
enclosure: dual chamber aluminum, sealed
mounting: 3in threaded or flange
pivot mount: available as standard
antena: lens-horn,from 1.5" to 8" diameter
electrical supply: 24Vdc, 0.5A
process connection: 4-20mA current loop, RS485 multidrop,
or RS232
*) - may be more, depending on application type
**) S&M Process Control Technology Inc. is the authorized distributor for 77GHz radar sensors manufactured by YMS.
S&M Process Control Technology Inc. (C) 17-April-2012